Graphing
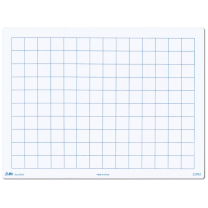
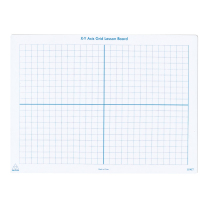
Being able to organise and analyse information and communicate findings in a well structured format makes interpreting data and information easier. Tables, graphs, and diagrams provide a visual communication tool that can be quickly understood. Graphing data is an excellent way to show progress, identify patterns & trends, make comparisons and track development.

